Kể từ bây giờ chúng tôi là Elev8
Chúng tôi không chỉ là một nhà môi giới. Chúng tôi là một hệ sinh thái giao dịch tất cả trong một—mọi thứ bạn cần để phân tích, giao dịch và phát triển đều có ở một nơi. Sẵn sàng nâng tầm giao dịch của bạn?
Chúng tôi không chỉ là một nhà môi giới. Chúng tôi là một hệ sinh thái giao dịch tất cả trong một—mọi thứ bạn cần để phân tích, giao dịch và phát triển đều có ở một nơi. Sẵn sàng nâng tầm giao dịch của bạn?
GBP/JPY has formed a right-angle triangle which indicates a breakout higher is likely.
Price is more likely to break above the flat edge, according to technical analysis (TA) theory, which in this case runs along the topside of the pattern.
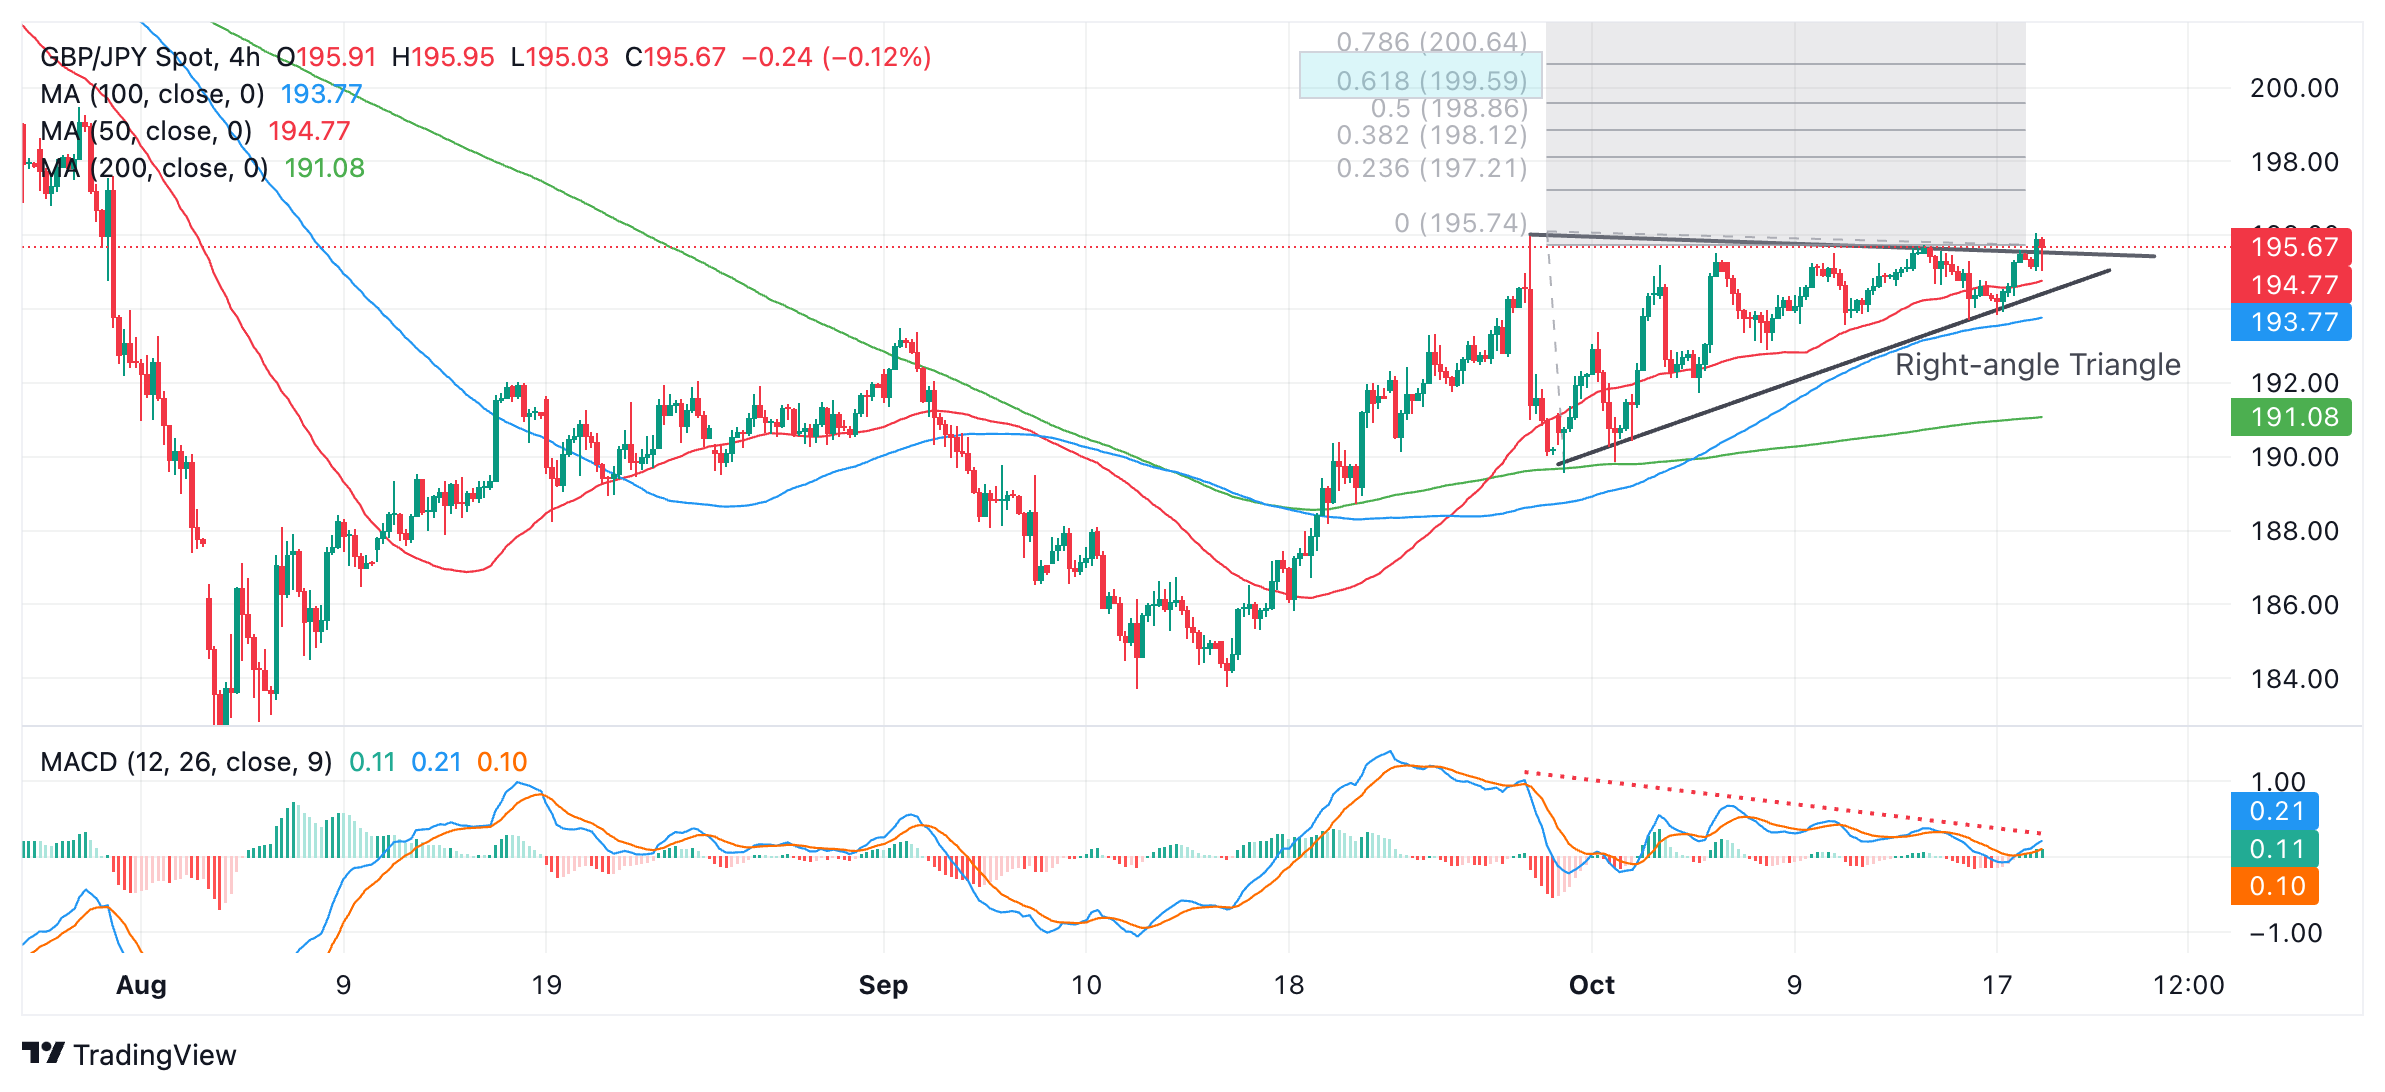
A decisive breakout above the top of the triangle would activate the pattern’s first upside target at 199.59, the 61.8% Fibonacci extrapolation of the height of the triangle (at its widest point) higher. This is the usual TA method for forecasting such moves.
One bearish sign is that the Moving Average Divergence Convergence (MACD) momentum indicator has been diverging bearishly with price during the formation of the triangle. Whilst price has made a higher high, MACD has declined. This is a mildly bearish sign.
A decisive breakout would be one accompanied by a long green candlestick that pierced cleanly through the top of the triangle at 196.00 and closed above near its high. This, or three green candlesticks in a row that broke cleanly above the flat top of the pattern.