Kể từ bây giờ chúng tôi là Elev8
Chúng tôi không chỉ là một nhà môi giới. Chúng tôi là một hệ sinh thái giao dịch tất cả trong một—mọi thứ bạn cần để phân tích, giao dịch và phát triển đều có ở một nơi. Sẵn sàng nâng tầm giao dịch của bạn?
Chúng tôi không chỉ là một nhà môi giới. Chúng tôi là một hệ sinh thái giao dịch tất cả trong một—mọi thứ bạn cần để phân tích, giao dịch và phát triển đều có ở một nơi. Sẵn sàng nâng tầm giao dịch của bạn?
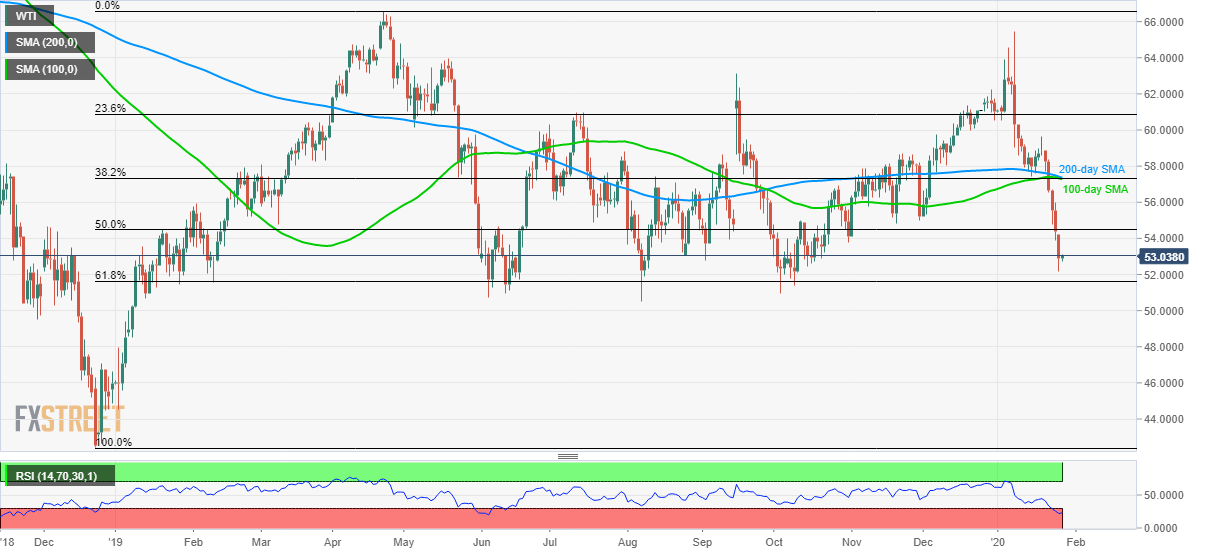
WTI bears catch a breath as the quote flashes $53.00 during the initial trading session on Tuesday. The energy benchmark recently dropped to the lowest since October and is declining towards 61.8% Fibonacci retracement of its upside from December 2018 to April 2019.
Even so, overbought conditions of RSI can help repeat the bounces off $51.60 key Fibonacci level, if not then $50.00 could try disappointing the sellers.
In a case where the black gold continues to linger beneath $50.00, high marked on December 26, 2018, near $47.00 will be in the spotlight.
On the flip side, a 50% Fibonacci retracement level of $54.50 could please the short-term buyers during the pullback.
However, a confluence of 100 and 200-day SMA, as well as 38.2% Fibonacci retracement, will cap the rise around $57.25/35, if not then a fresh run-up towards $60.00 could be expected.
Trend: Pullback expected