Kể từ bây giờ chúng tôi là Elev8
Chúng tôi không chỉ là một nhà môi giới. Chúng tôi là một hệ sinh thái giao dịch tất cả trong một—mọi thứ bạn cần để phân tích, giao dịch và phát triển đều có ở một nơi. Sẵn sàng nâng tầm giao dịch của bạn?
Chúng tôi không chỉ là một nhà môi giới. Chúng tôi là một hệ sinh thái giao dịch tất cả trong một—mọi thứ bạn cần để phân tích, giao dịch và phát triển đều có ở một nơi. Sẵn sàng nâng tầm giao dịch của bạn?
USD/JPY rises to 109.86, following the uptick to an intra-day high of 109.91, during the early Friday. In doing so, the quote recovers the previous day’s losses while taking a U-turn from 50-bar SMA.
While the current upside rush highlights a monthly falling trend line resistance, at 110.12, the quote’s further advances are likely to be tamed considering bearish MACD and normal RSI.
In a case buyers manage to cross 110.12, January month high near 110.30 holds the key to pair’s run-up towards May 2019 top surrounding 110.70.
On the downside, 50-bar SMA of 109.73 and a horizontal area comprising 38.2% Fibonacci retracement of January month upside near 109.30 can restrict the quote’s short-term declines.
During the pair’s declines below 109.30, 108.70/65 becomes important as it includes an ascending trend line from January month low and 61.8% Fibonacci retracement level.
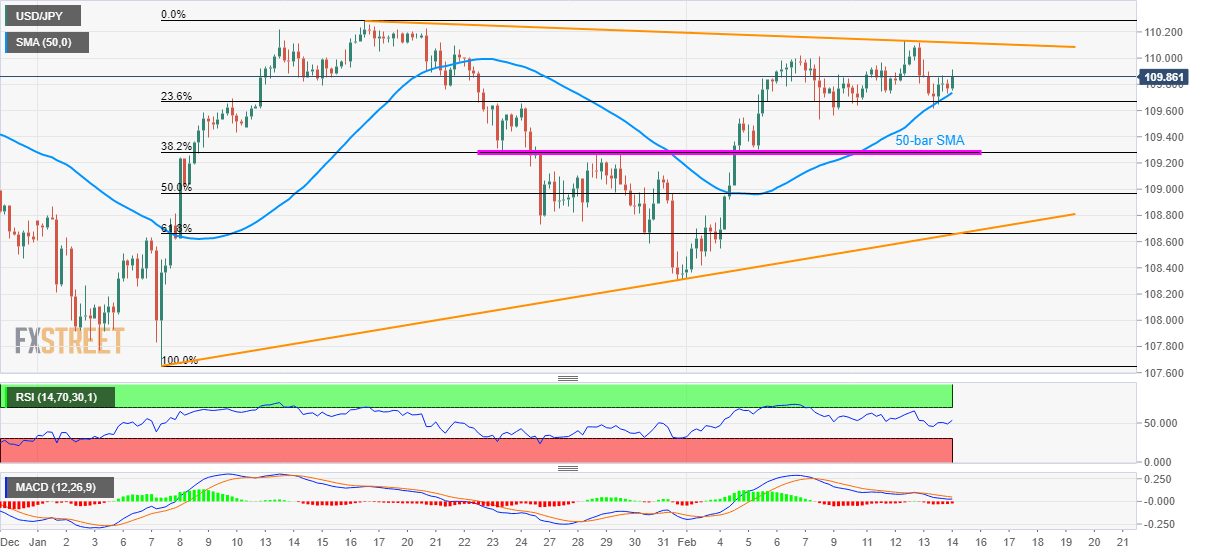
Trend: Pullback expected